How to Measure Customer Satisfaction Using Happiness Reports
Welcome to our guide on measuring customer satisfaction using Happiness Reports. As a business, understanding how satisfied your customers are is crucial to providing exceptional service and driving loyalty. Happiness Reports in Help Scout offer valuable insights into customer interactions, allowing you to gauge their sentiments and identify areas for improvement. In this guide, we'll walk you through the process of generating and analyzing Happiness Reports, interpreting key metrics, and using the data to make informed decisions. Learn how to track customer satisfaction trends over time, evaluate agent performance, and enhance your support strategy for better customer experiences. Let's dive into the world of Happiness Reports and harness the power of customer feedback.
1
Sign up or log in to Help Scout
First, sign up for a Help Scout account or log in to your existing account. If you don't have an account yet, you can create one by visiting their website at www.helpscout.com
2
Navigate to the Reports tab
Once you're logged in to your Help Scout account, click on the "Reports" tab located in the main menu at the top of the screen.
3
Select the Happiness report
In the Reports section, you'll see different types of reports that Help Scout provides. Click on the "Happiness" report to view your customer satisfaction metrics.
4
Choose the desired date range
To specify the period for which you'd like to generate the Happiness report, click on the date range selector located at the top right corner of the page. You can choose from predefined date ranges like "Last 7 days," "Last 30 days," or select a custom date range.
5
View the Happiness Score
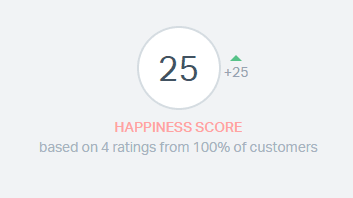
The Happiness Score is a percentage that represents the overall satisfaction of your customers based on their responses to satisfaction surveys. This score is displayed at the top of the Happiness report. A higher percentage indicates a higher level of customer satisfaction.
6
Analyze the breakdown of responses
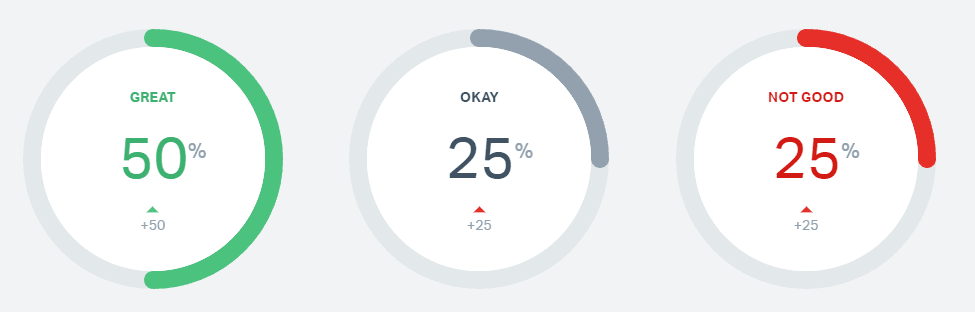
Under the Happiness Score, you'll find a breakdown of customer responses in the form of a bar chart. This chart displays the number of "Great," "Okay," and "Not Good" ratings your support team has received during the specified date range. Use this information to identify trends and areas for improvement.
7
Review individual customer feedback
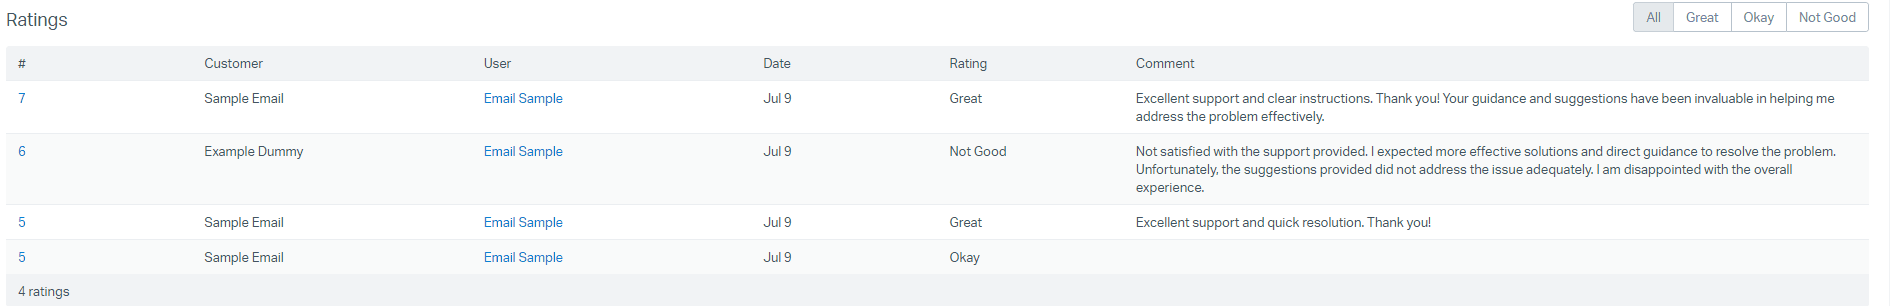
Scroll down the Happiness report to view individual customer feedback. This section displays each customer's rating, their comment (if any), and the corresponding conversation. Use this information to understand the specific reasons behind customers' ratings and to identify potential areas for improvement.
Congratulations on completing our guide on measuring customer satisfaction using Happiness Reports. By delving into the world of customer feedback, you've unlocked valuable insights that will drive your support strategy to new heights. The ability to track key metrics, evaluate agent performance, and identify customer sentiment trends empowers your team to make data-driven decisions and prioritize improvements that matter most to your customers. Continuously monitoring Happiness Reports will help you stay attuned to customer needs and respond swiftly to any emerging concerns. Remember that customer satisfaction is an ongoing journey, and leveraging Happiness Reports as a tool for improvement is an essential part of the process. With your newfound knowledge, take customer experiences to the next level and forge lasting connections that drive loyalty and growth. Thank you for joining us on this journey to better understand your customers and deliver exceptional support experiences.


